Hello folks, here we initiated a series of articles where we will make a practical and theoretical approach, this powerful and that is little explored Reporting Services. In that first moment we see the version of SQL 2005, is still the standard tool database in most of our customers, but we soon an explanation of the 2008 version, good fun.
PART 1 - INTRODUCTION TO REPORTING SERVICES
Microsoft SQL Reporting Services is a comprehensive reporting platform. Part of the Business Intelligence framework based on services, tools, APIs for development, publishing and management reports, the RS was initially presented as an add-on for SQL Server 2000 in early 2000, then the 2005 and finally the 2008.
Reports of RS are based on RDL (Report Definition Language), which is nothing more than a dialect of XML created by Microsoft. And, since the environment is closely integrated with RS platform. NET framework, its development tools are Visual Studio 2005 and 2008 - even though the actual SQL Server 2005 has a shell called Visual Studio 2005 Business Intelligence Development Studio ( BIDS).
With RS you can create reporting solutions as part of an application, called Local Mode, which is similar to the model used in Crystal Reports or Microsoft Access. Besides this, we model the remote reporting, operating as a web application hosted on a Web Application Server (IIS) and accessible via HTTP protocol. Finally, we have, through the Report Builder tool, a way for users to create their own reports, attending corporate environments, developers, architects and users.
For any reporting solution that makes use of the RS environment, makes use of the evidence adduced in the figure below. Since the interaction between these elements varies according to the model of the report - but they will always be present, the process of creation to consumption by the end user.
 |
| Figure 1.1 - Correlation between elements of Reporting Services |
In Figure 1.1, we have the diagram of the relationship between the key elements of a solution based on Reporting Services, which will detail the following relationship:
Reports
Correspond to the front-end data and properly formatted to match a graphical representation of a functional and operational RDL file, with specific characteristics, according to their type. Reports can be invoked by a client application - be it a Windows application, Web, by any technology that consumes WebService or even the environment itself Reporting Services.
Application client
Applications are able to implement, manage and view reports, and the Main Report Manager, BIDS, Visual Studio applications. NET Windows and web through ReportViewer control, and application-Office Report Builder Model.
Structure volatile data structures are created in memory to temporarily store the results of queries that will be displayed in reports. These queries are implemented as stored procedures, views, T-SQL statements as well as OLAP cubes. DB Access Engine are the various possible mechanisms to access the data. Corresponds to the sources of data access to SQL Server, Oracle, OLE DB, ODBC and Analysis Server Databases - OLAP.
Data repositories
They are the data sources from which it extracts the information for reports created and accessed via the Access DB Engines.
RS supports some of the most useful types of reports, assisting users in better distribution of information, they are:
Tabular : used to distribute the information as a table, with a number of columns previously established, similar to data from excel;
Free: The information is placed arbitrarily as is most convenient for the user. P eg reports the type master-detail;
Chart: The data is presented graphically; Correlation: the report information are correlated in two Cartesian axes forming an array, for example, a report of the temperature from a set of cities;
DrillDown: reports that allow expandable sections, such as correlation reports, x products sales, which allow you to display subcategories of products; Interactive: are reports that allow the use of special features such as documentMap, links, among others. For example, reports similar to the view of the document with Adobe Reader PDFs with bookmarks.
 |
Figure 1.2 - Tabular Report
|
 |
Figure 1.3 - Correlation report
|
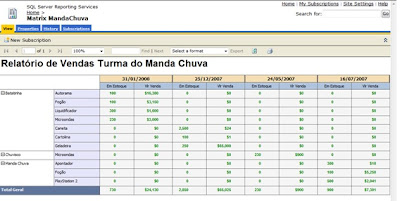 |
Figure 1.4 - drilldown report
|
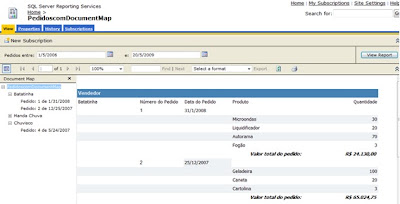 |
| Figure 1.5 - interactive report |
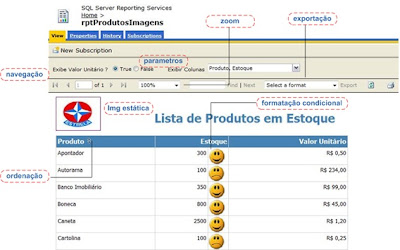 |
| Figure 1.6 - features |
That's it, folks! So far we only started our exploration to the fantastic world of Reporting Service. In the next issue we will see the first of report templates: the so-called "Local Mode."
Best regards...